Chapter 9 Objects in the Two-Dimensional Coordinate System
Section 9.2 Lines in the Plane9.2.2 Coordinate Form of Equations of a Line
Let us first introduce the most general form of a coordinate equation of a line. Using this equation, every line in the plane can be specified as an infinite set of points with respect to a given coordinate system.
Info 9.2.2
A line in is a set of points
Here, , , are real numbers that define the line. At least one of the numbers and must be non-zero. The linear equation
is called the equation of a line or, more specifically, to distinguish it from other forms of equations of a line, as coordinate form of the equation of a line. A common abbreviation for the explicit set notation given above is to specify only the variable of the line and the equation of the line:
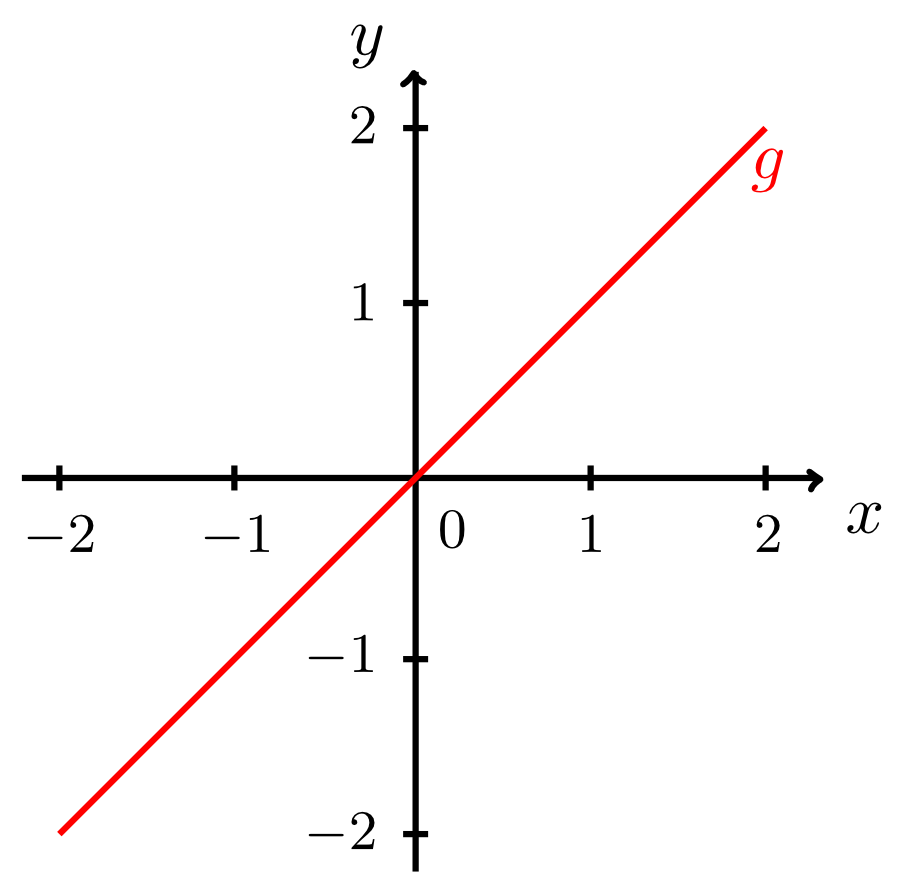
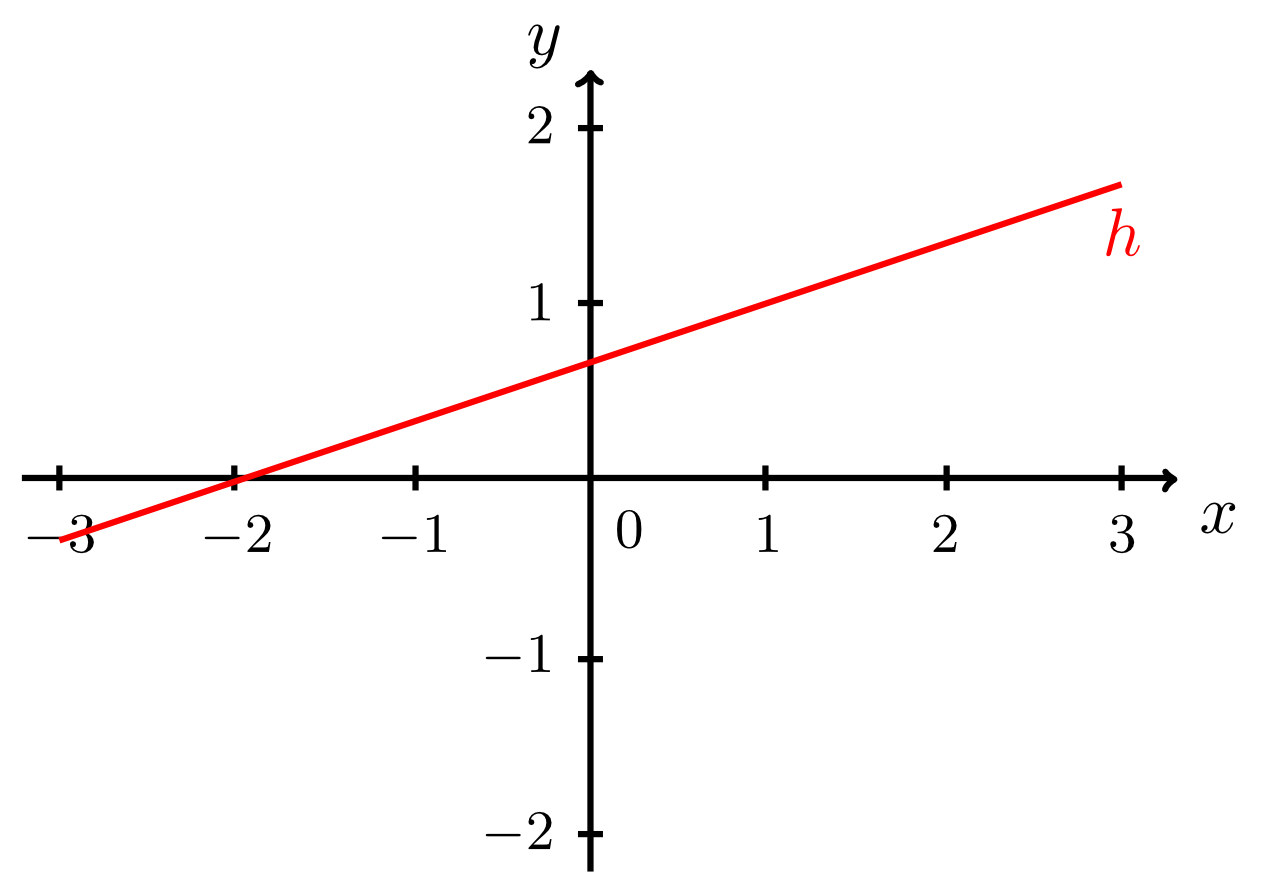
The example below shows a few lines and their set notations or equations.

Now we want to be able to draw a line correctly in a coordinate system in . The line can be uniquely defined by an equation of a line, or by other data. To do this, we have to establish a relation to the graphs of linear affine functions. We also need to know by what kind of data a line in the plane is uniquely defined. This information will be given below.
Info 9.2.4
A line given by an equation of a line in coordinate form
can be converted into normal form if . In this case, the equation of a line can be solved for , and the normal form of is then
In this form, the line describes a graph of a linear affine function with the slope and the -intercept :
Since the slope and the -intercept can be read off from the equation of a line in normal form, lines can be drawn in the same way as the graphs of linear affine functions.
Example 9.2.5
The line
has the equation in coordinate form. This equation can be converted into the form by equivalent transformations of linear equations. Thus, the line has the normal form
and it describes the graph of the linear affine function
with the slope and the -intercept .
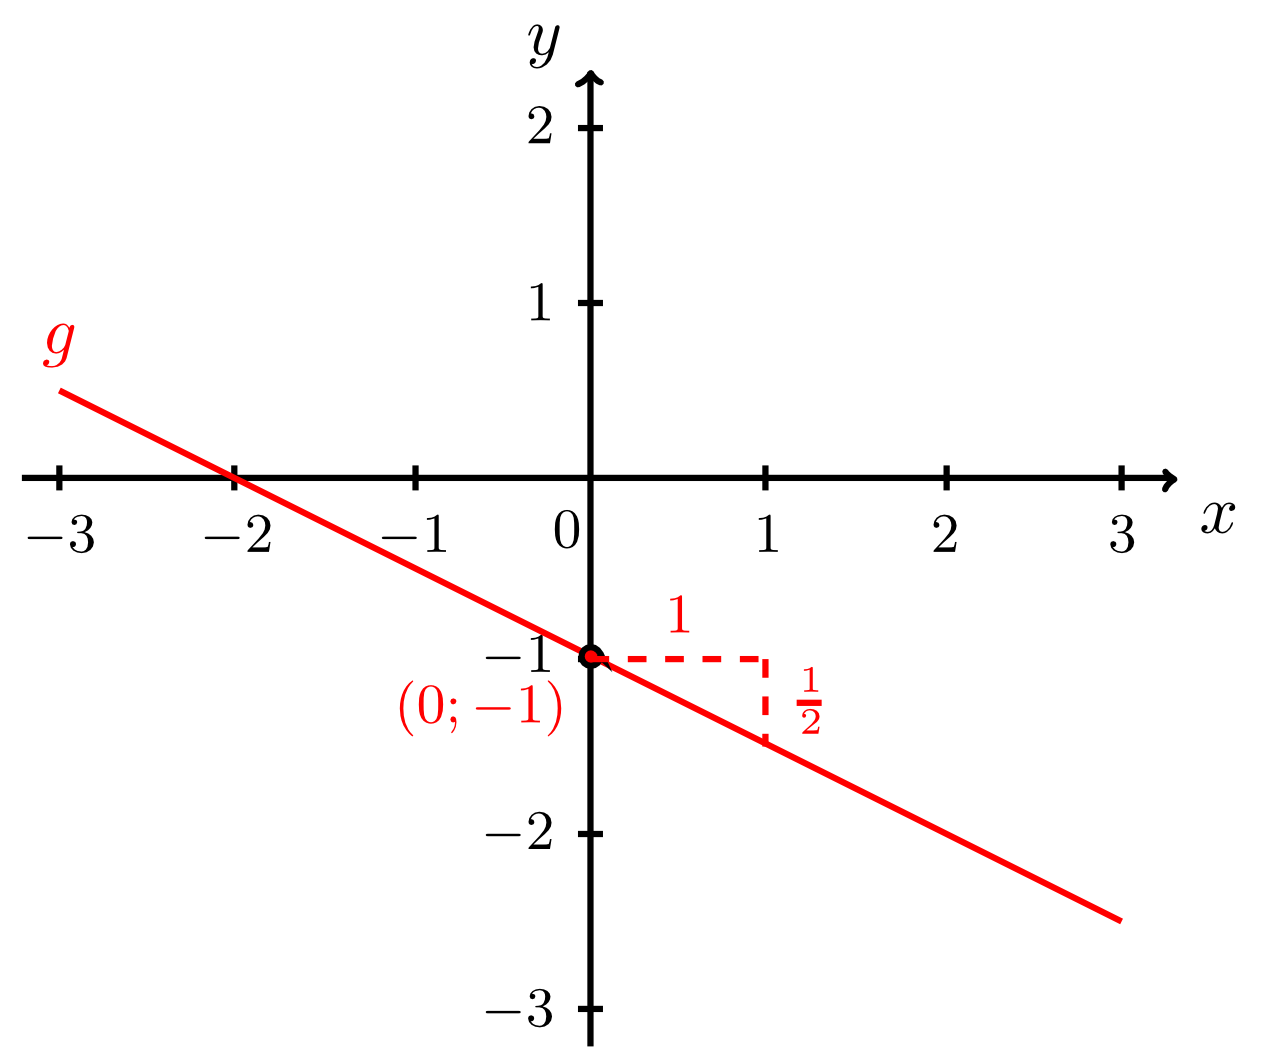
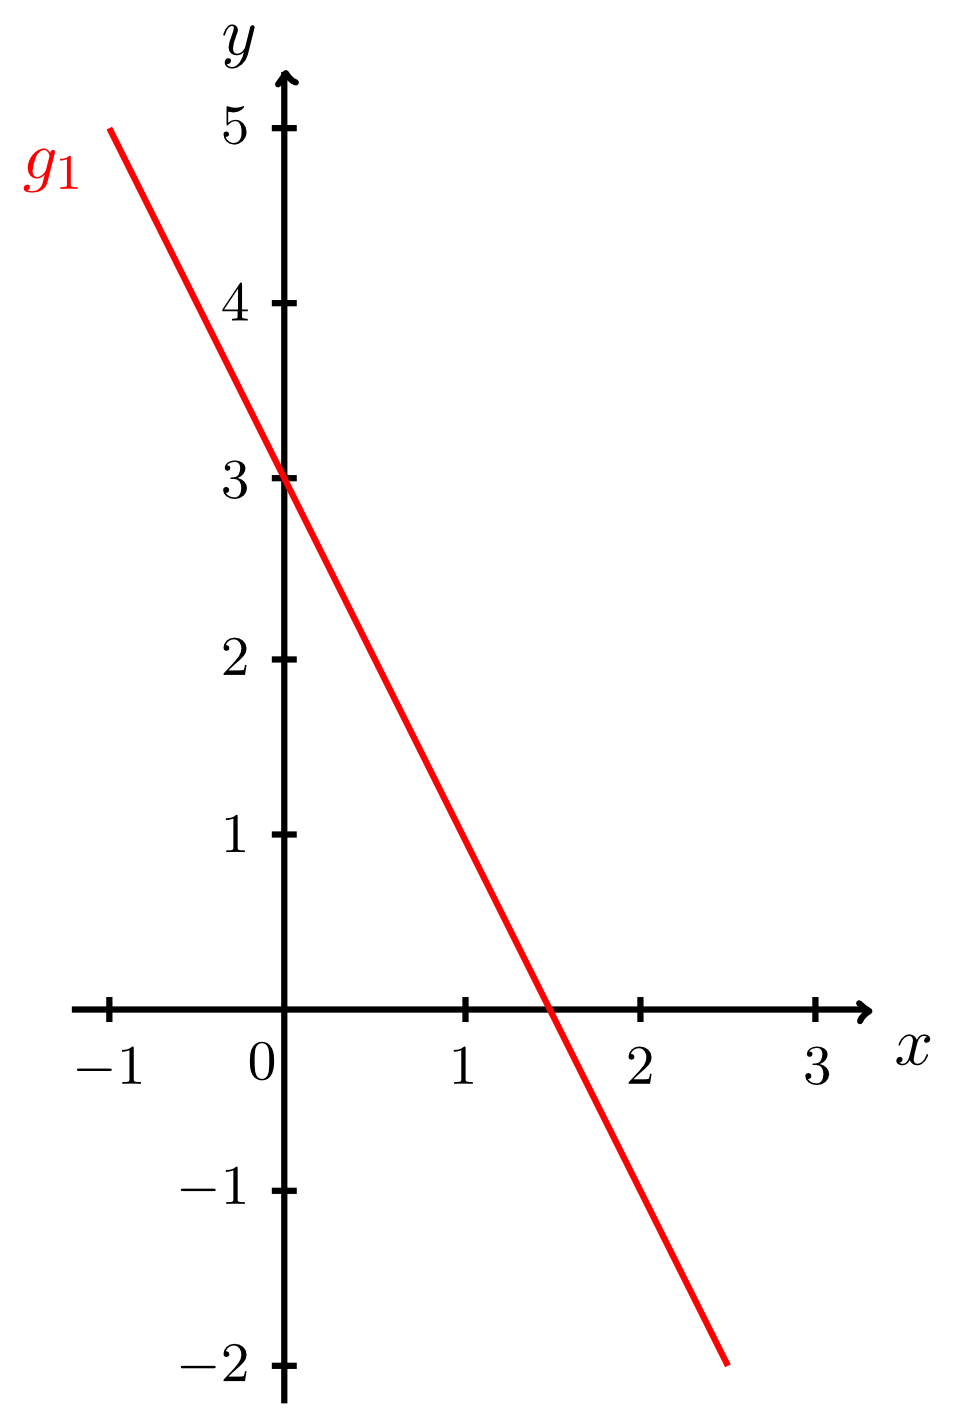
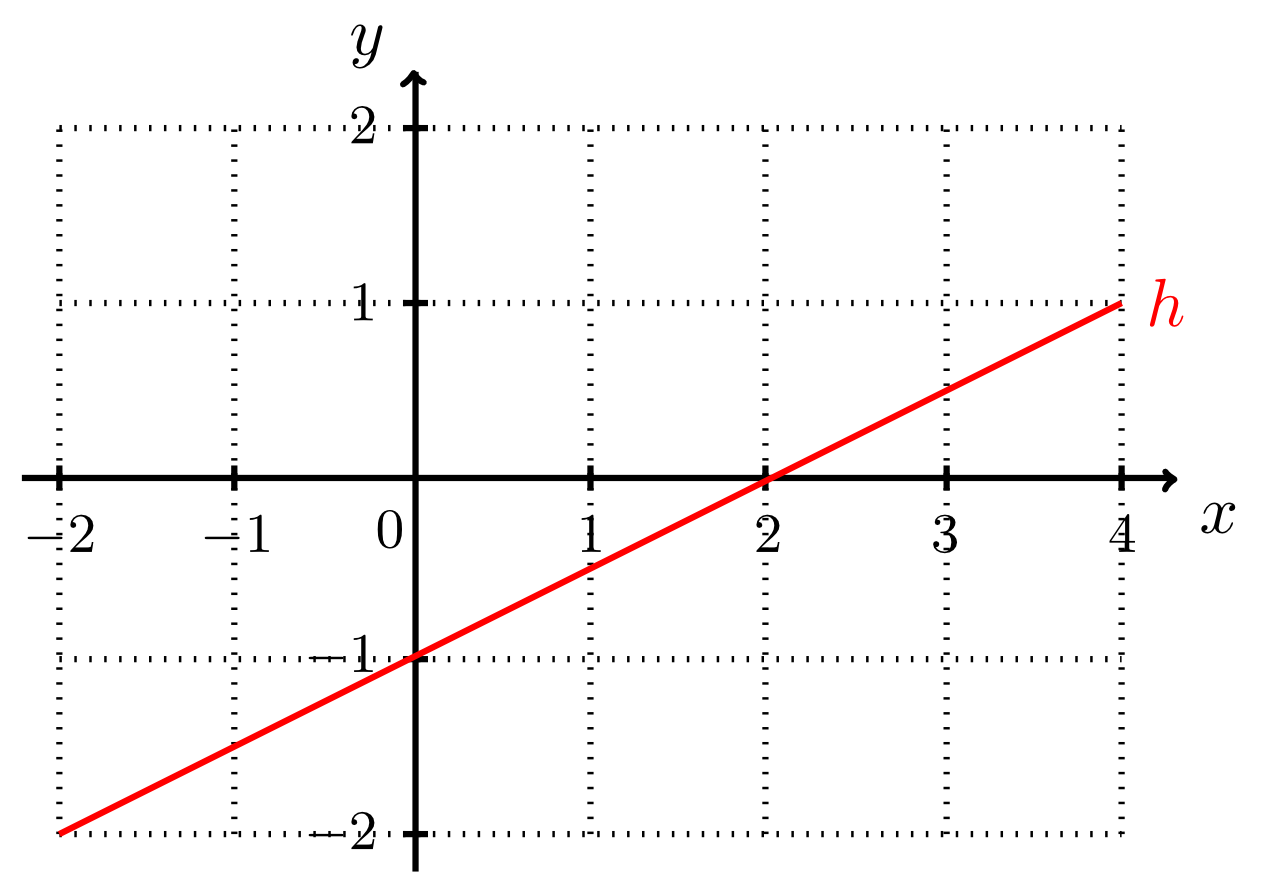
To draw one has to understand the following: the -intercept implies that the point lies on . Starting from this point, the line can be drawn correctly by constructing a slope triangle of slope (by units to the right and by units downwards) in the correct direction:
has the equation in coordinate form. This equation can be converted into the form by equivalent transformations of linear equations. Thus, the line has the normal form
and it describes the graph of the linear affine function
with the slope and the -intercept .
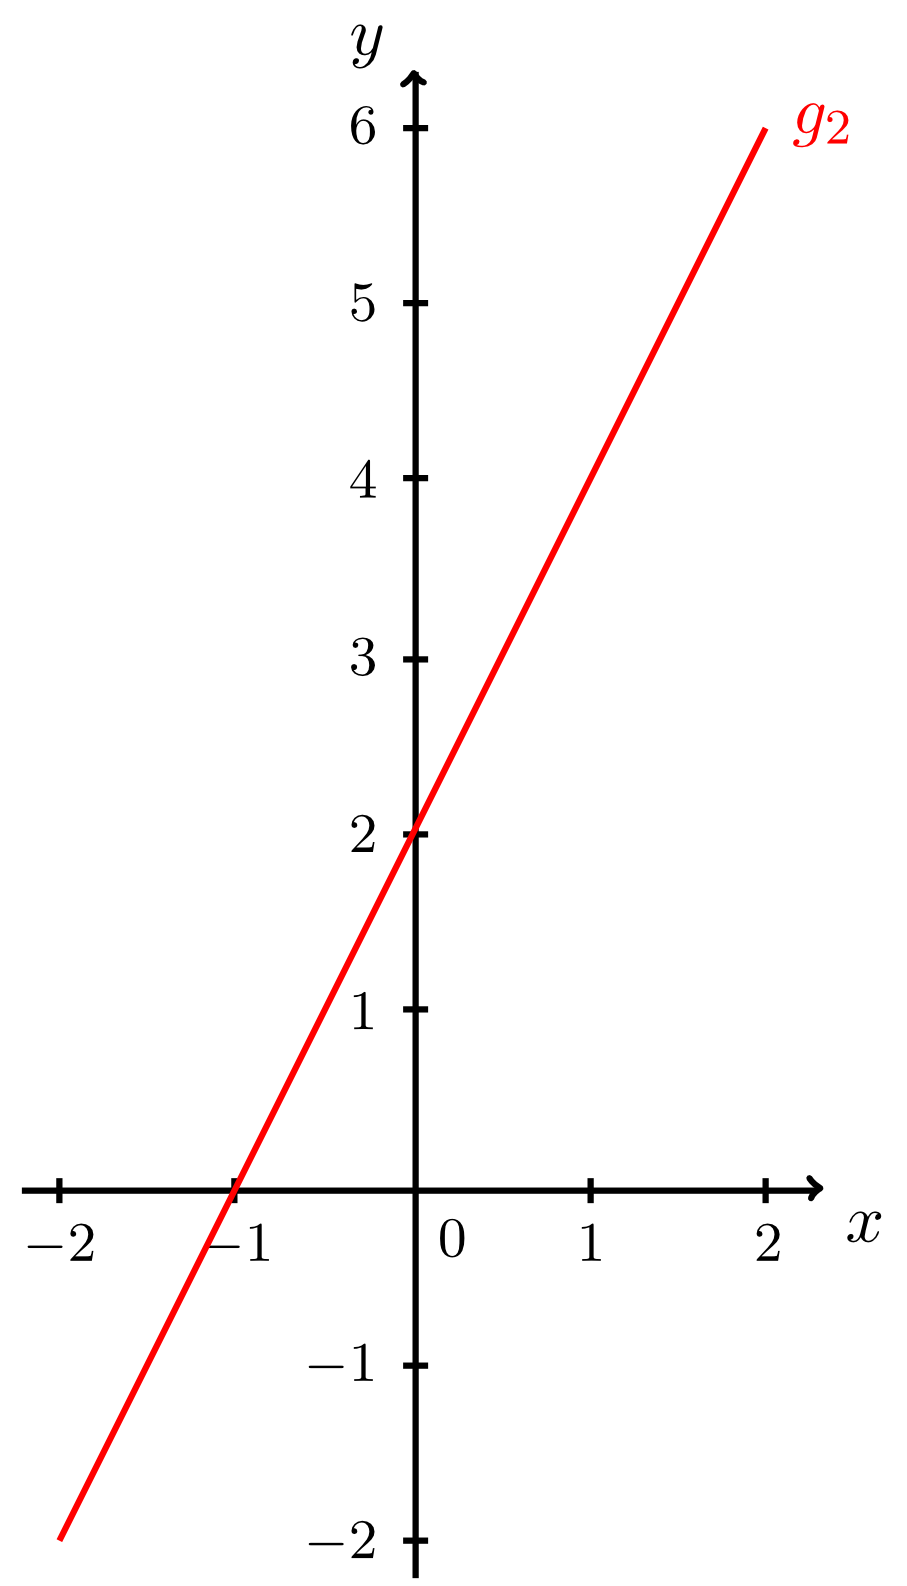
To draw one has to understand the following: the -intercept implies that the point lies on . Starting from this point, the line can be drawn correctly by constructing a slope triangle of slope (by units to the right and by units downwards) in the correct direction:
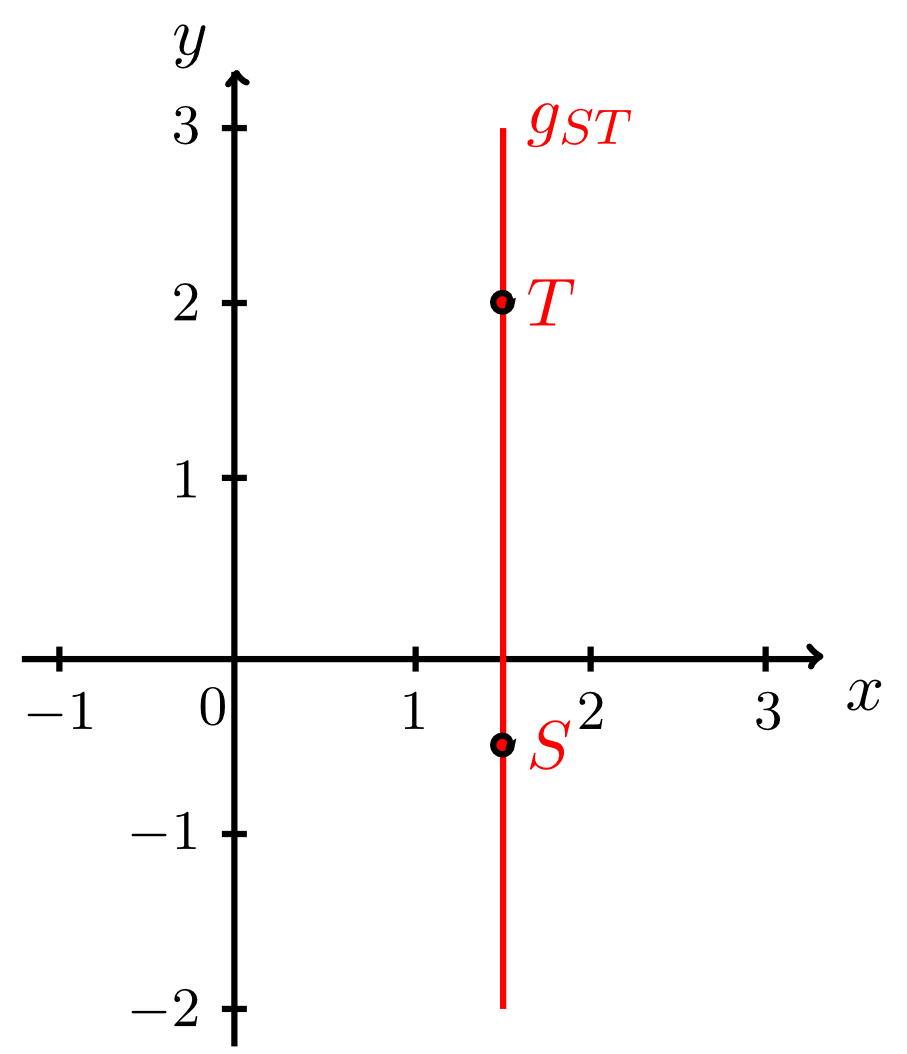
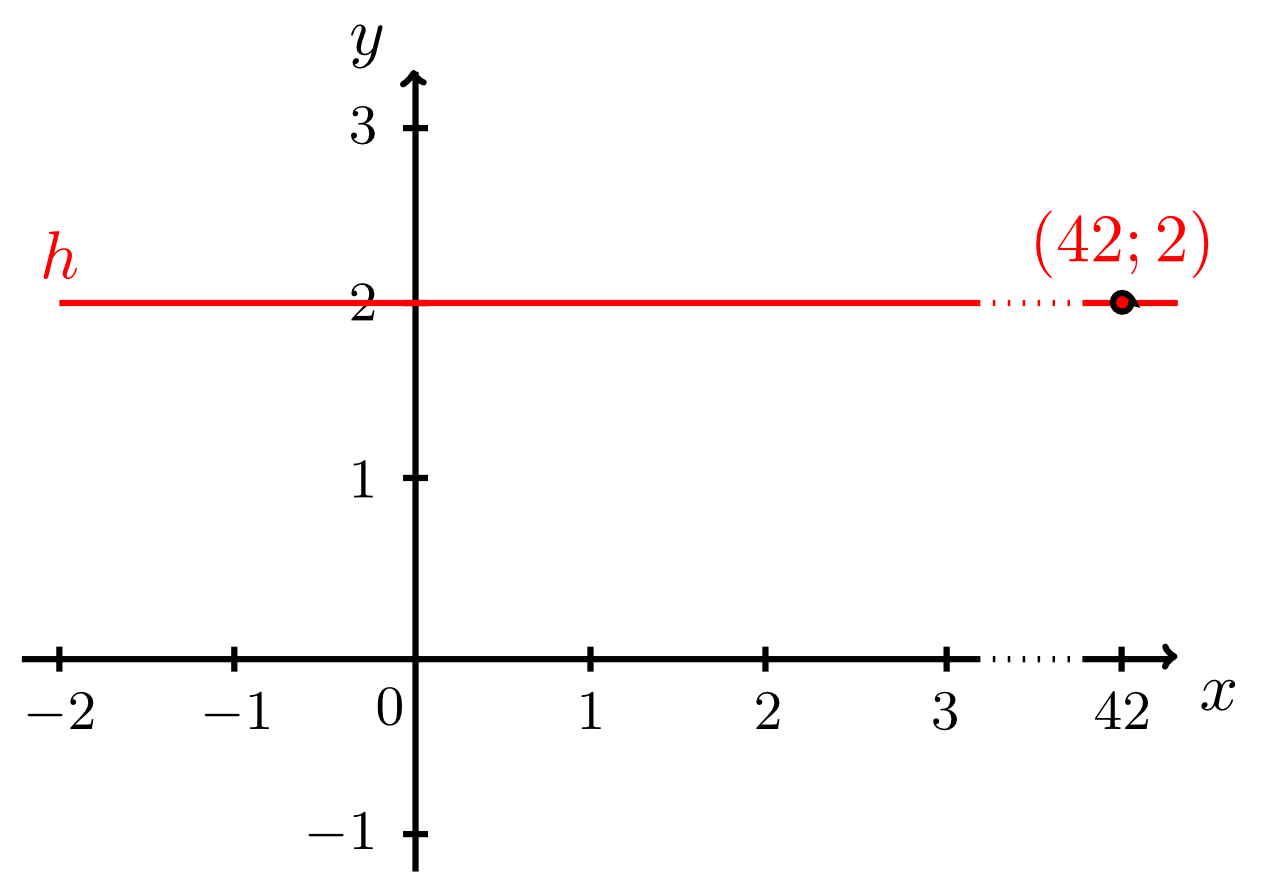
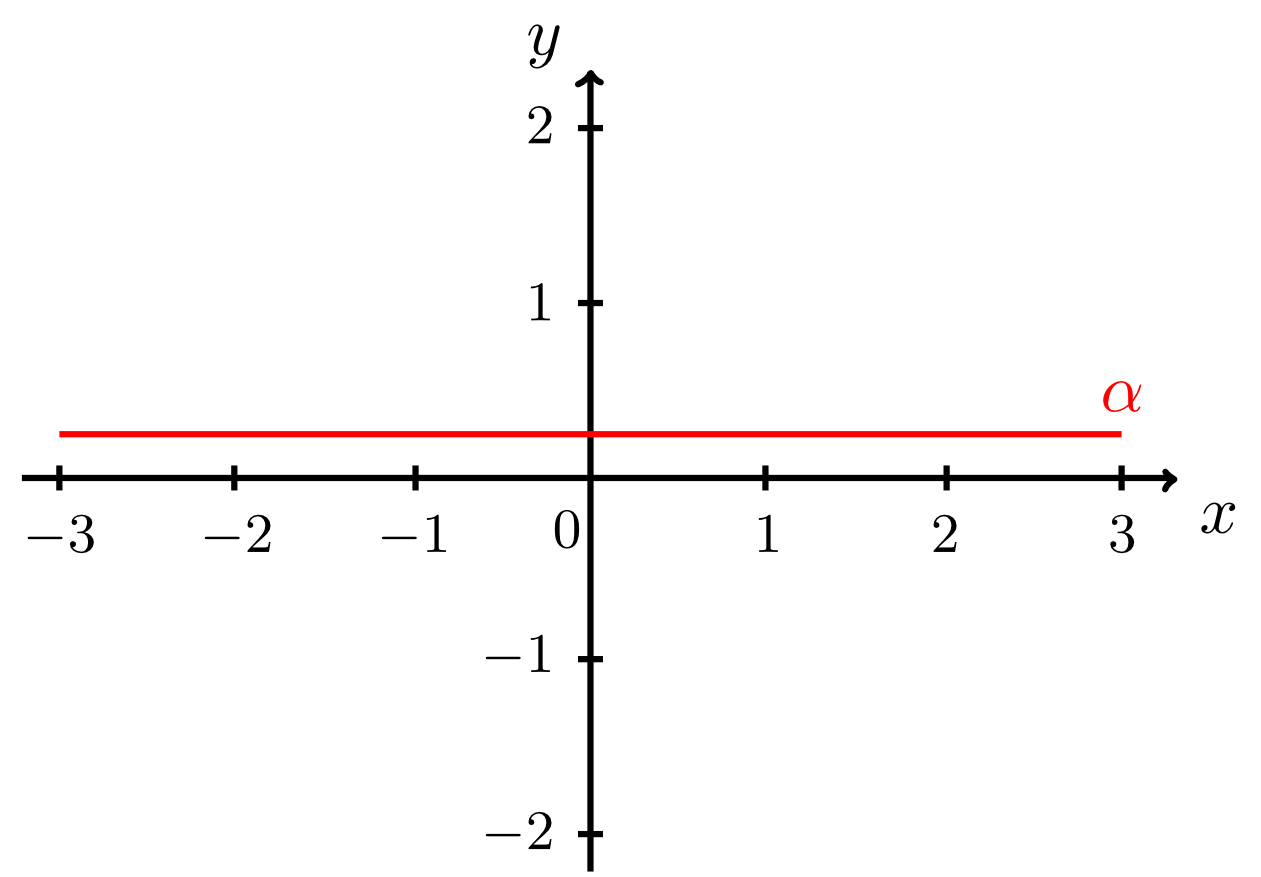
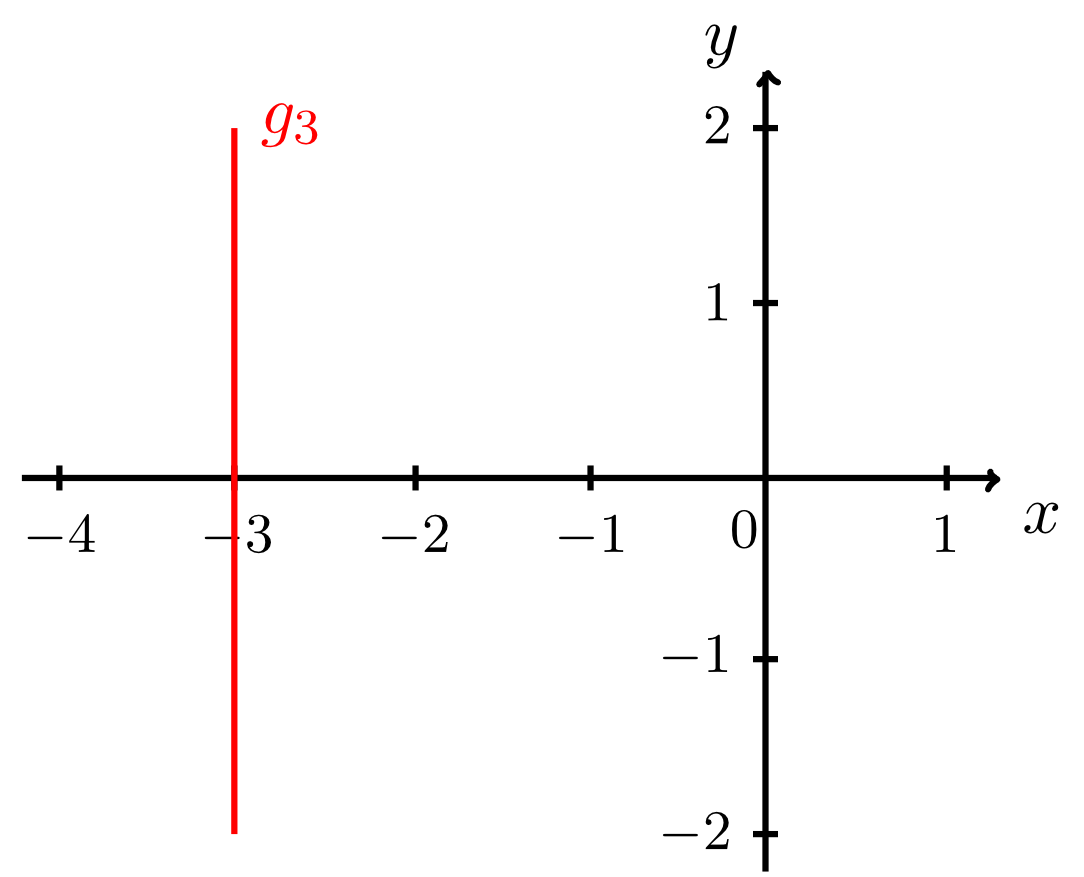
There two special cases: they can be demonstrated by the two lines and in Example 9.2.3 (see figure below).

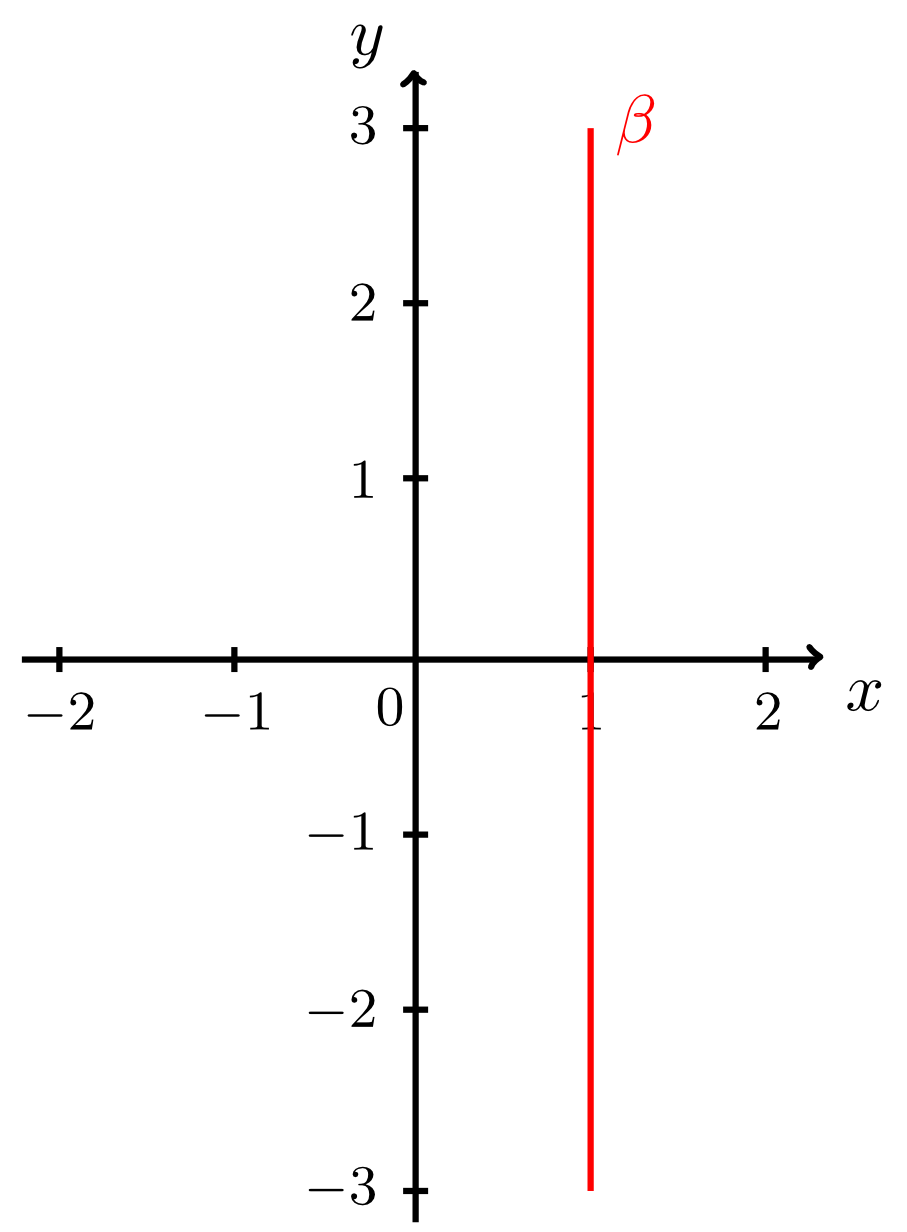
The line is parallel to the -axis. Thus, its normal form describes the graph of a constant function as a special case of the linear affine functions. The line is parallel to the -axis. Its equation of a line cannot be converted into normal form since . This is true for all lines that are parallel to the -axis.For such lines a normal form does not exist, since these lines cannot be a graph of a function (as discussed in Section 6.1.4). Lines that are parallel to the -axis have neither have a -intercept (since they do not intersect the -axis) nor a slope. However, for the sake of consistency, they can be assigned a slope of .
Exercise 9.2.6
Draw the following lines in a coordinate system. Convert the corresponding equation of a line (if required and possible) into normal form first.
As well as by an equations, a line in the plane can also be uniquely defined by other data. From these data, the corresponding equation of a line can be derived, and the line can be drawn in a coordinate system.
Info 9.2.8
There are two alternative ways to uniquely define a line in the plane:
- "A line is uniquely defined by two points" If two points and in are given, there exists exactly one line that passes through the points and . The line passing through and is then also denoted by or simply by .
- "A line is uniquely defined by a point and a slope" If a point in and a slope are given, there exists exactly one line that passes through and has the slope .
The two following examples illustrate how the equation of a line can be derived from the data that uniquely define this line, and how this line can be drawn.
Example 9.2.9
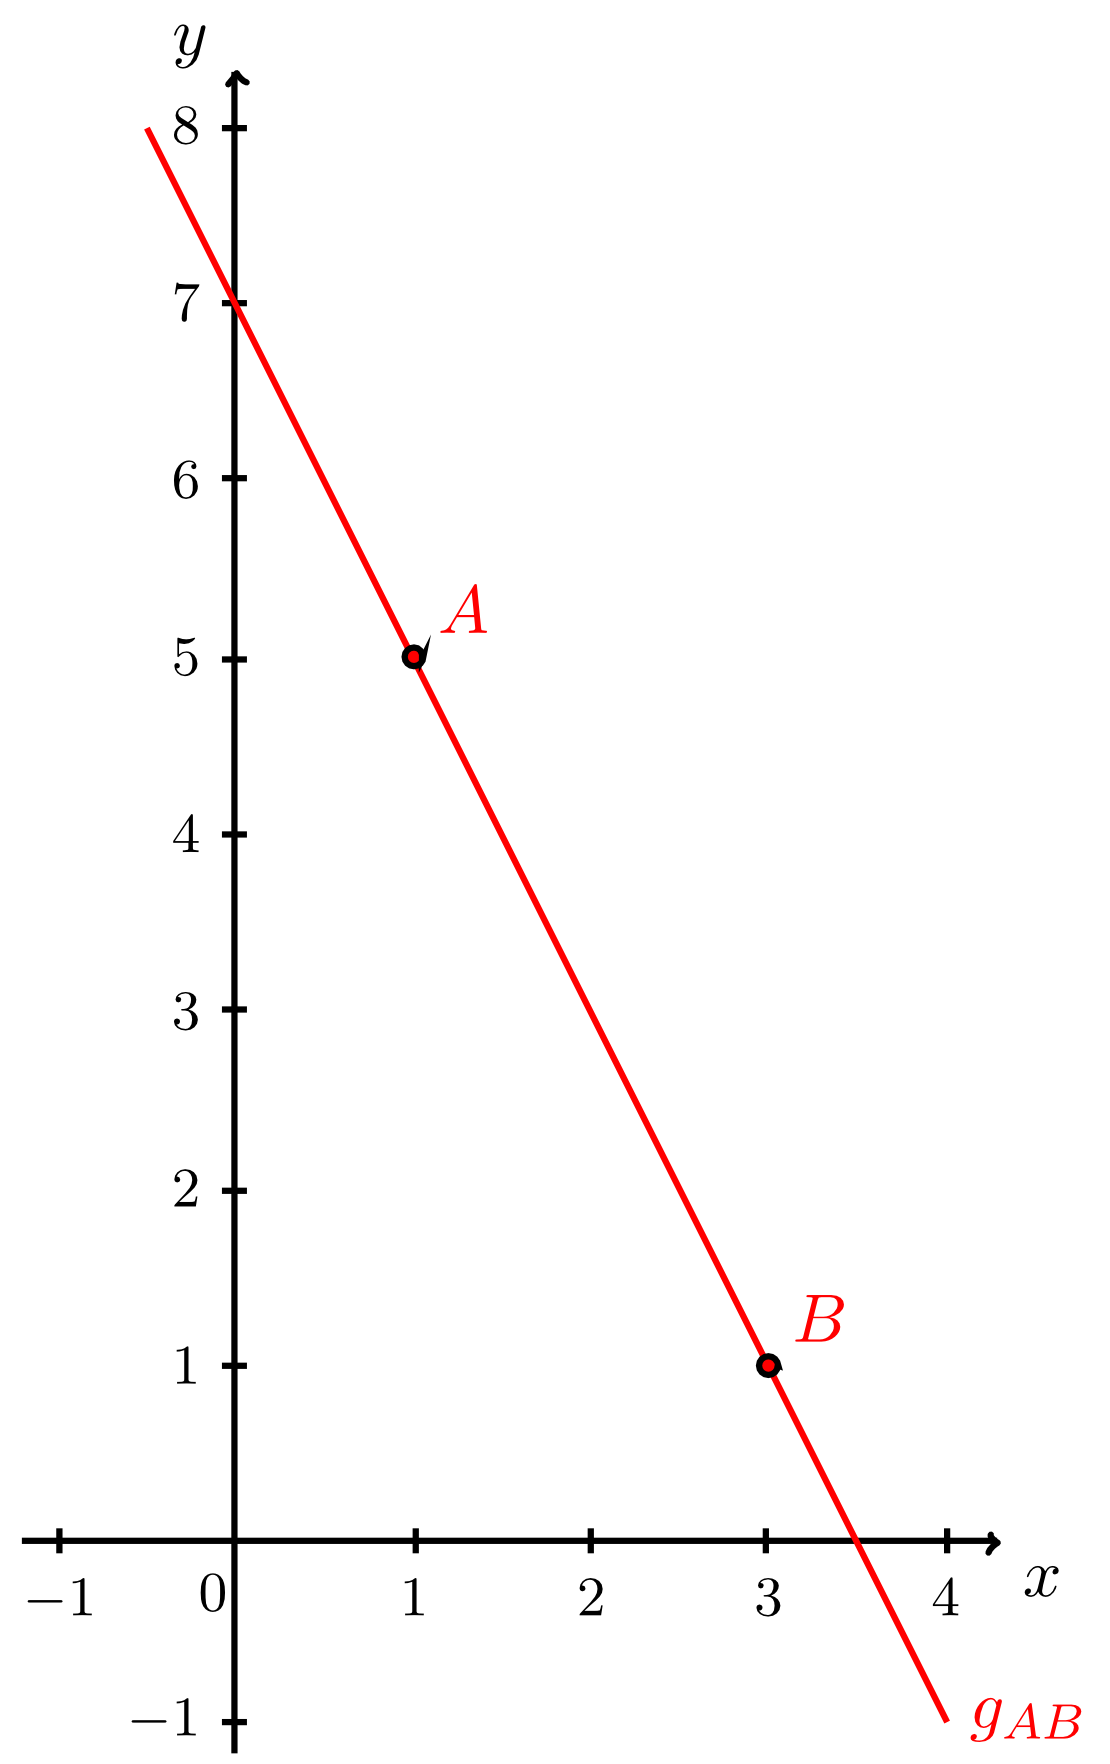
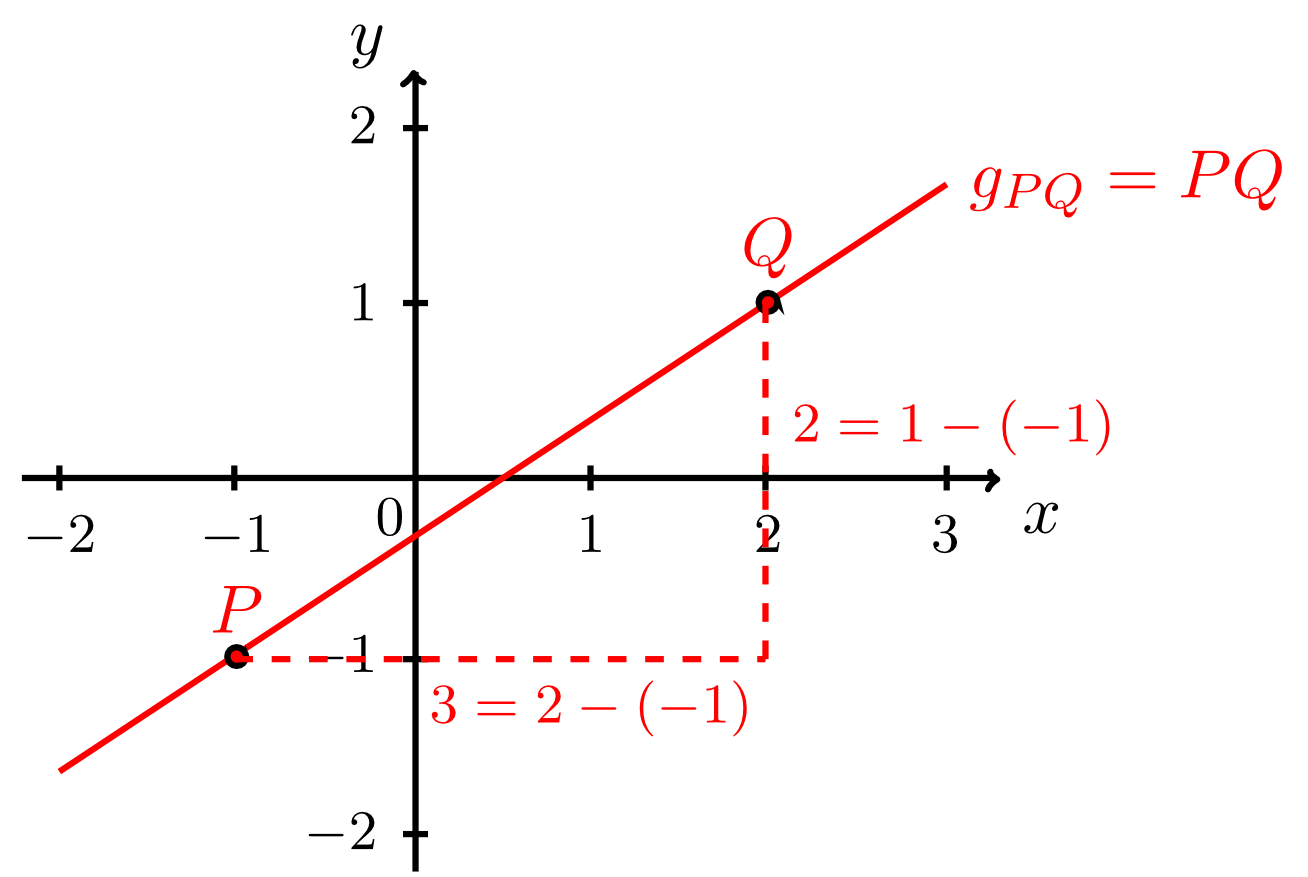
Let the points and be given. The line passing through these two points can be drawn immediately. To determine the line of equation it is useful to construct a slope triangle from the two given points:
From the -coordinates and of and we obtain the width of the slope triangle. From the corresponding -coordinates and we obtain its height . Thus, the slope in the equation of the line is . For the normal form of the equation of the line we thus obtain:
Now, only the -intercept has to be determined. We know that the line passes through the two points and . Therefore, we can substitute the - and -coordinates of one of these points into the equation of the line, and calculate . Substituting, for example, the coordinates of the point results in
Using the point would result in the same equation. Thus, the required equation of the line in normal form is
Example 9.2.10
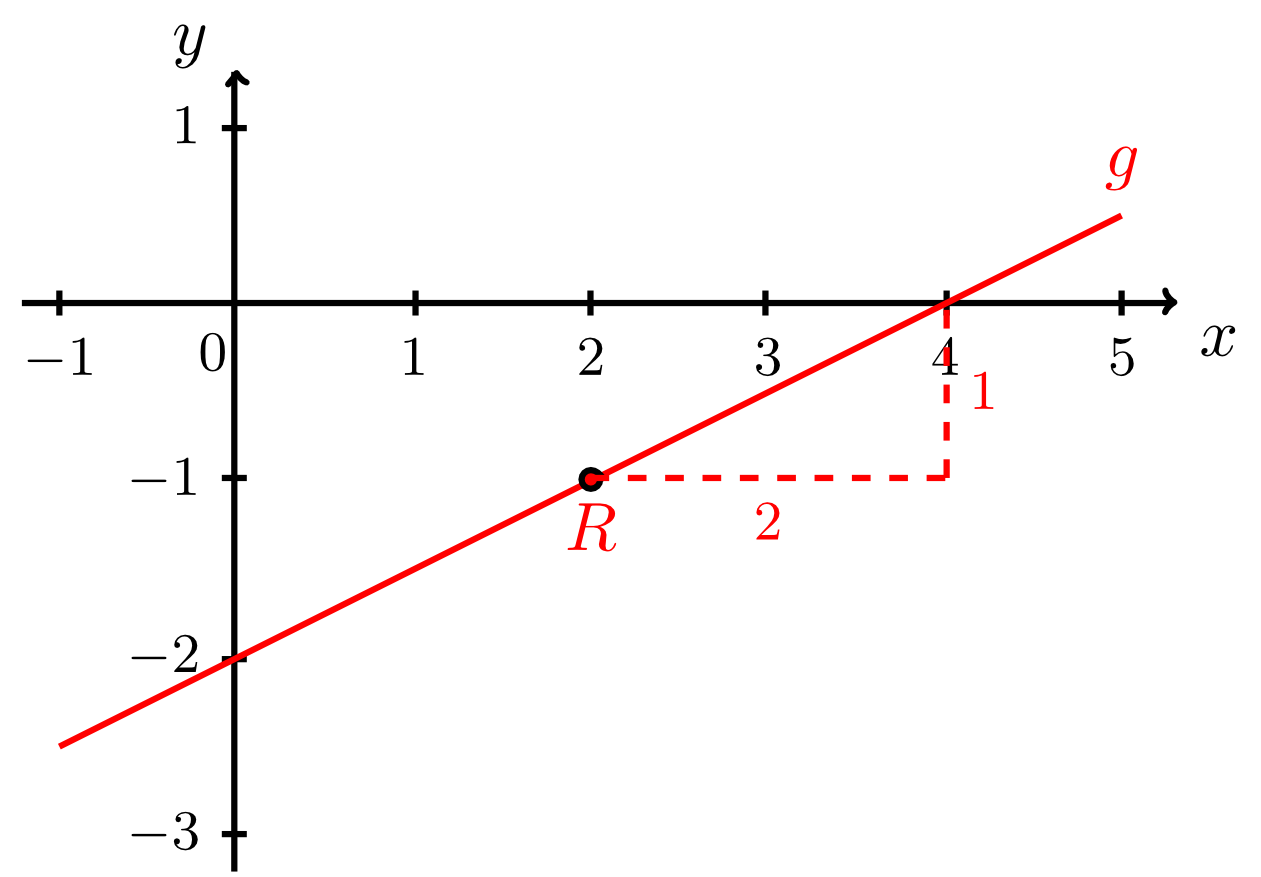
Let the point and the slope be given. Find the line that passes through the point and has the slope . As in Example 9.2.9, the equation of the line in normal form can be specified immediately while the -intercept is still unknown:
Moreover, both the coordinates and of the point are given here from which the -intercept can be calculated, as in Example 9.2.9:
Thus, the required equation of the line is
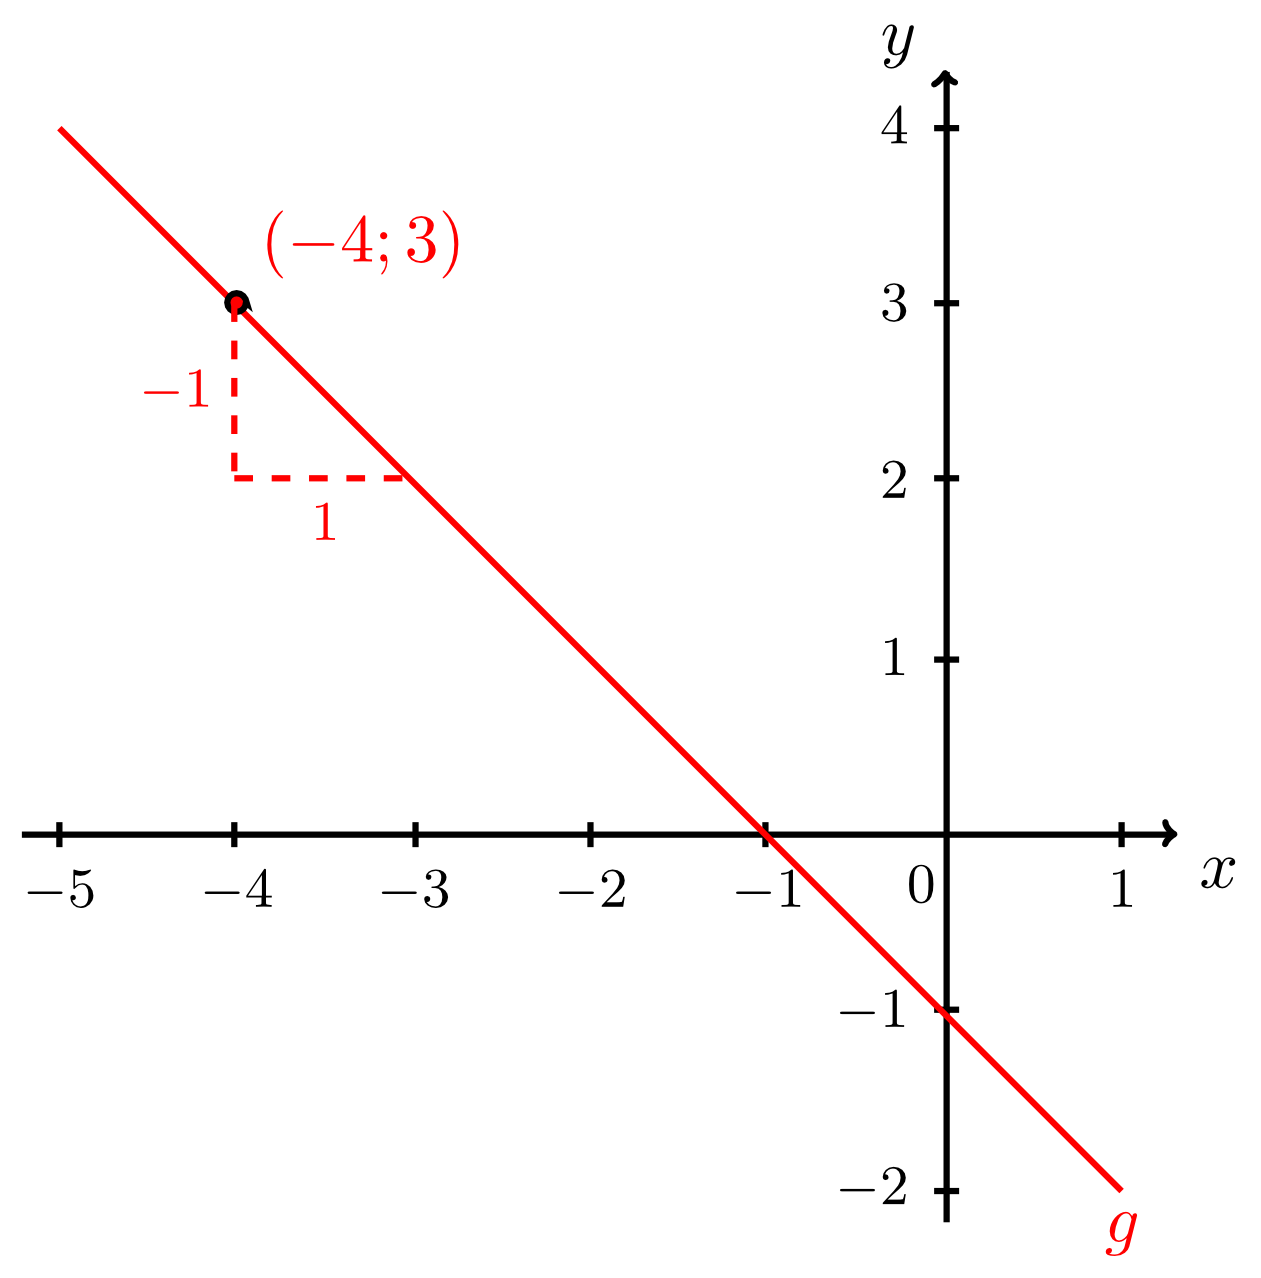
Using the point and the slope , the line can also be drawn immediately as illustrated by the figure below.
Moreover, both the coordinates and of the point are given here from which the -intercept can be calculated, as in Example 9.2.9:
Thus, the required equation of the line is
Using the point and the slope , the line can also be drawn immediately as illustrated by the figure below.
Exercise 9.2.11
Every set of data given here defines a unique line. For each one, give the equation of the line and then sketch it.
- The points and are on the line.
- The points and are on the line.
- The line passes trough the point with a slope of .
- The line passes trough the point with a slope of .